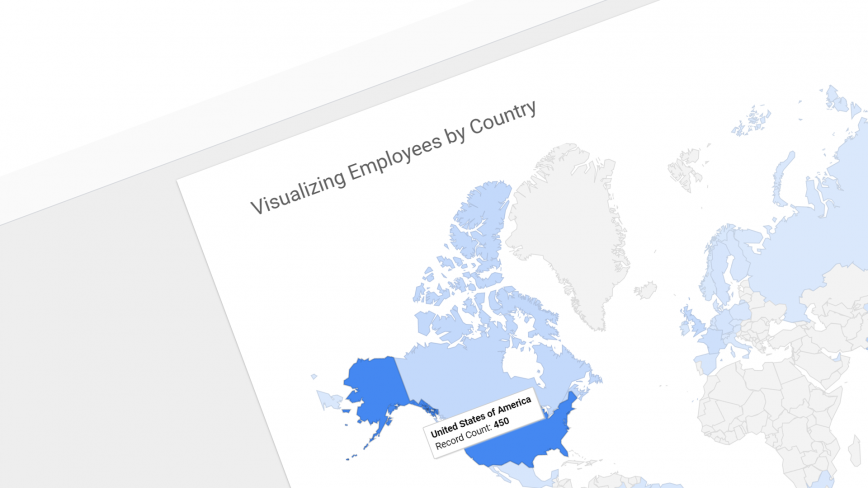
Visualize Employee Locations with Augmented Reality

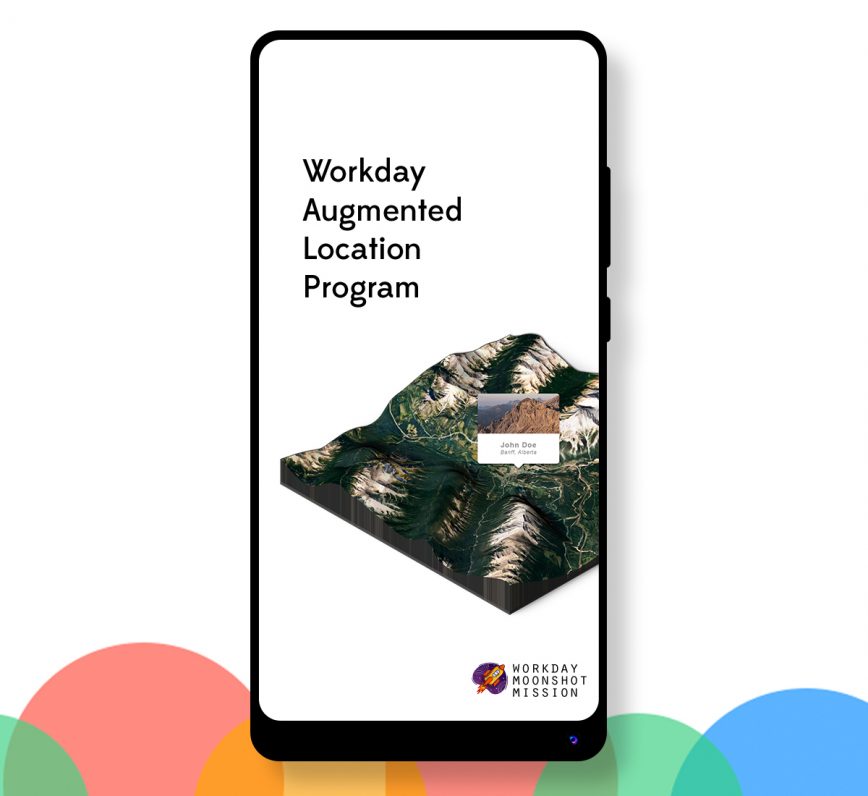
If your employees work at different locations, you may want to visualize those facilities in a map; perhaps with worker population heatmapping to understand employee distribution, or with wayfinding to help your employees find each other and collaborate. As part of ongoing research on voice and visual interfaces, I developed a chatbot-guided employee location visualization […]

Visualizing Data with Google BigQuery and Data Studio

Every company is a data company. Corporations rely on sourcing, managing and manipulating data to understand their products, customers, and employees. As data collection services become more detailed and integrated into everyday applications, visualization is crucial to separate important data from nonsense, identify causal and cor-relational relationships, and ultimately, tell a story. In this post, we’ll […]

Build a Winning Conference Survey

Conferences and trade shows provide a great opportunity to gather information from potential customers and clients, partners and competitors. Meaningful, intuitive surveys and polls are gatekeepers to that data; they need to extract the right information without being intimidating or lengthy. Recently I got the chance to showcase at the Ontario Centre’s of Excellence Discovery Conference. […]